Democracy, tram stop by tram stop
Manchester University academics Kingsley Purdam and Rob Ford say that voter turnout is the lowest in the areas most in need of better democracy
The 2018 local elections across England will be held on 3 May, but despite their importance for policy they are likely to pass most people by. Turnout in local elections averages around 30 per cent, meaning over two thirds of people don’t take part. In some cases, the numbers are far lower still. In the 2012 local elections one ward had a turnout of 13 per cent and some polling districts within wards can record turnouts in single digits. This compares to the 2017 general election where the lowest turnout in a constituency was 54 per cent and the highest was 79 per cent. In the 2016 local elections the average turnout across wards in England was 34 per cent, the lowest level of turnout in a ward was 16 per cent and the highest level was 53 per cent. But it’s worse than this: some local elections literally go uncontested as only one candidate is standing.
Official turnout statistics are based on the percentage of the people registered to vote who actually do so. But many people are not on the registers. The registers are around 90 per cent accurate and it is estimated that around 7.5 million people are not correctly registered at their current address in Great Britain. People move home and electoral registers lag behind.
Many things affect whether people decide to vote. Their level of interest in politics, views of politicians, party identification, their sense of civic duty, trust, the type of area where they live and their age, gender, ethnicity, martial status, social class, level of qualifications and religion can all play a role – and this is not an exhaustive list. In general, those people who have higher incomes and those with higher levels of qualifications are more likely to turn out and vote.
Turnout is also likely to vary according to the nature of the contest. Elections seen by voters as more important (like general elections or referendums) generally attract more people to the polls. So do close contests, and elections with intense local and national campaigning. The personal touch also counts – people are more likely to vote when they have been contacted by parties, but particularly when they are canvassed in person by local party representatives. But many people are not that interested, and it doesn’t take much to turn some of them off the idea of voting. Bad weather or even a longer walk to the polling station can reduce turnout.
The low levels of turnout at local elections reflect the lower profile of local elections, which attract less media coverage and are seen by many voters as less important. However some people have a specific attachment to a local issue or politician and a stronger sense that they can make a difference in local affairs, which can drive turnout. Many people vote for a different party at a local election compared a general election, even if both elections are held on the same day – something which boosts local turnout a lot.
Greater Manchester is home to 2.7 million people living in 10 local authorities. It includes some of the most economically deprived areas of the UK. In the context of the ongoing debates about the nature of Brexit and devolved government in the North West we have mapped the turnout levels from the 2016 local elections to each tram stop on the Manchester Metrolink, to illustrate the stark differences in political engagement that occur even in small areas.
The turnout rates shown here are based on the percentage of people on the electoral register who voted. They include postal votes and invalid votes, such as spoiled ballots. We also include information on the level of socio-economic deprivation in the areas where the tram stops are located using the Index of Multiple Deprivation (IMD). The IMD is an official measure, which ranks local areas across England in terms of the levels of employment, education and health. Here we show the decile of the area ranking in relation to England as a whole.
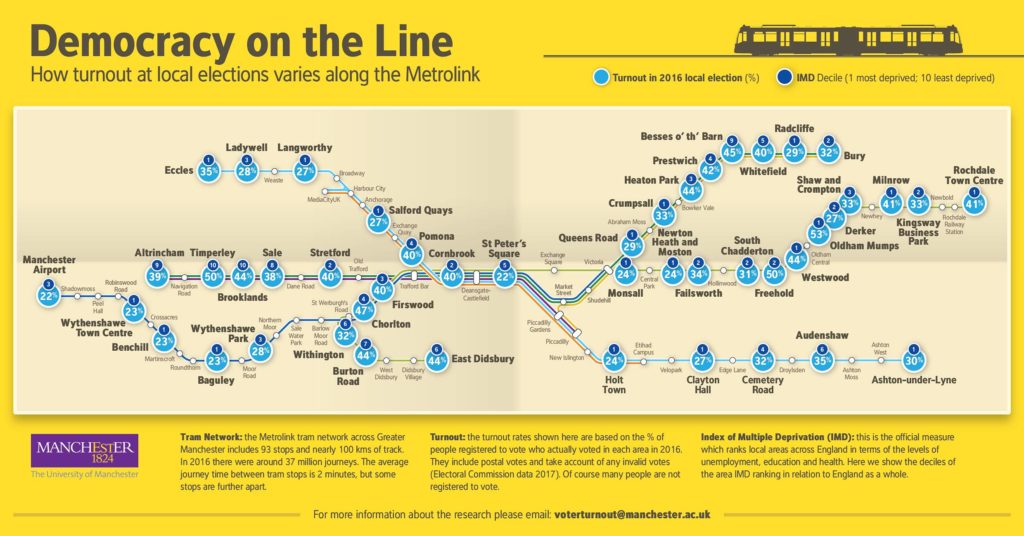
As the map highlights, electoral turnout varies considerably across Greater Manchester, even between local areas. Moreover these rates don’t take account of the many people who are not registered to vote.
Of the tram stops highlighted 15 are in areas where turnout was less than 30 per cent. Most of these stops are in areas ranked as amongst the most economically deprived in Greater Manchester, and all are represented by Labour Party councillors. Only three tram stops are in areas which had turnout rates of 50 per cent or higher (Freehold, Timperley and Oldham Mumps). Many closely connected tram stops are in areas which can have very different levels of electoral turnout. For example, Chorlton and Withington are just a few minutes apart, but there is a 15 percentage point difference in electoral turnout.
The journey from Timperley (one of the most economically prosperous areas in Greater Manchester) to central Manchester (one of the most economically deprived areas) takes around 25 minutes, and involves a drop in voter turnout of 28 percentage points. The average journey time between Wythenshawe town centre and Chorlton is 24 minutes, with turnout rising 24 percentage points on this short journey. In both these examples, the highly economically deprived area has very low political engagement, while the more economically prosperous stop has much higher turnout.
However deprivation is not the only factor influencing turnout. For example, the tram stops of Oldham Mumps and Freehold are in some of the most economically deprived areas of Greater Manchester (and England for that matter), but the levels of turnout in these areas are amongst the highest.
The differences in electoral turnout across local areas are striking. In many areas very few people vote despite the fact that politics dominates much of the news and that political decisions are directly linked to the laws we live by, the public services we pay for and access, and the regulation of the markets.
Whilst a range of factors are linked with electoral turnout, overall turnout is lower in areas of economic deprivation. Yet it is just these areas that are most in need of more democratic accountability and policy maker engagement in order to hear the views of the residents and for economic and social problems to be addressed. Often the areas in the UK which have the highest levels of economic deprivation are the most in need of political policy interventions and accountability, and have the biggest democratic deficits. This is likely to be linked to people’s sense of engagement and belief that the electoral system and politicians can represent their views and deliver change. This can produce a vicious circle, with low engagement levels reducing the incentive for politicians to listen and respond to communities, who then become even more disheartened and disengaged.
Despite a range of initiatives aimed at increasing the levels of political engagement, there is still a disconnect between the policy makers and the people. Perhaps the next local elections will start to change this but, given the magnitude of the challenge, there will still be much work left to do after the votes are counted and the newly elected councillors take their seats.
@socialstatsman, @robfordmancs
This research is part of ongoing work at the University of Manchester. For more information please contact voterturnout@manchester.ac.uk

Leave a reply
Your email address will not be published.